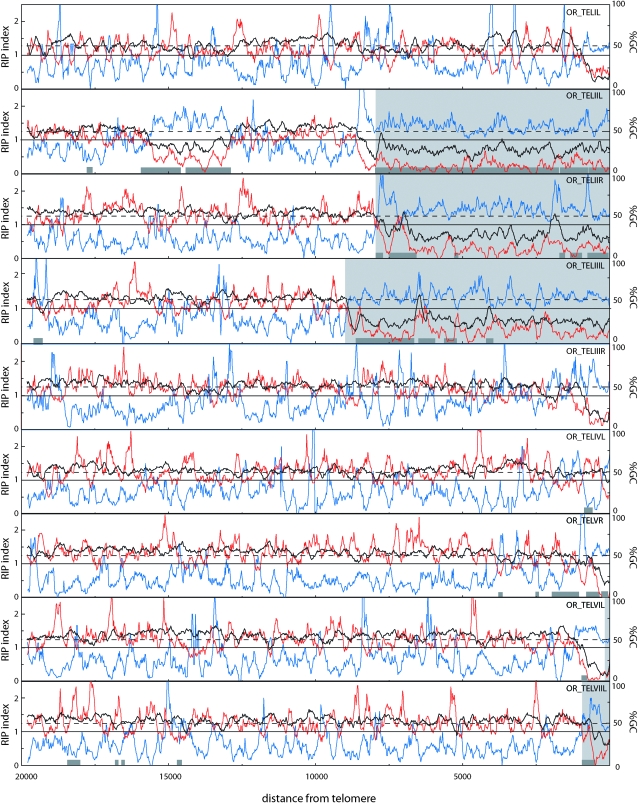
Figure 4.—
Sliding-window analysis of nucleotide composition at OR chromosome ends. The analysis was performed on chromosome ends for which at least 20 kb of sequence was available. GC content (%) and RIP indices I (TpA/ApT) and II (CpA + TpG/ApC + GpT) were calculated in a 200-bp window, which was slid in 20-bp increments across the terminal 20 kb of each chromosome end. The telomere repeats were excluded from the analysis. The black line represents the percentage of GC (%GC), RIP index I is plotted in blue, and RIP index II in red. The x-axis shows the distance from the right edge of the window to the start of the telomere array. The light gray areas highlight sequence regions that are not present at the homologous telomeres of the M strain (see below). Dark gray boxes show the positions of sequences that are closely related to sequences found elsewhere in the genome.

