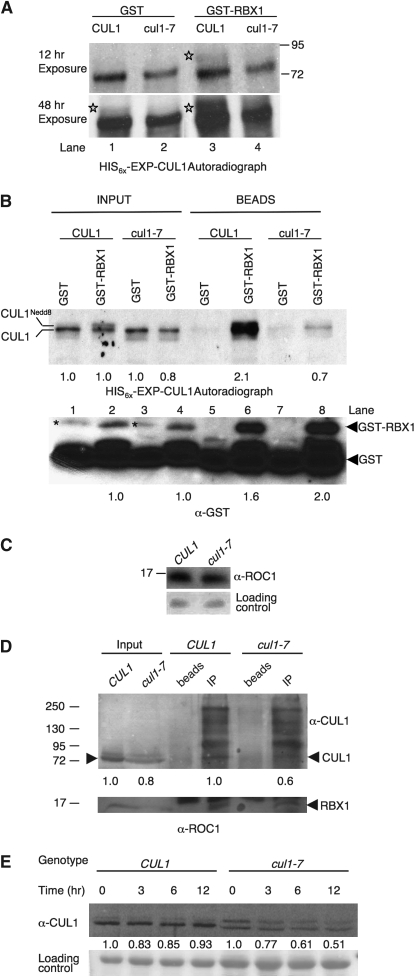
Figure 9.—
RBX1 interaction with cul1-7 is impaired and cul-7 destabilizes CUL1 protein. (A) In vitro translations of HIS6x-EXP-CUL1 and HIS6x-EXP-cul1-7 in the presence of GST-RBX1. Proteins were translated in vitro and radiolabeled with 3H −Leu. Reactions were supplemented with ∼125 ng either GST or GST-RBX1. Stars were placed to the left of CUL1Nedd8 bands. (B) Pull-down of in vitro translated HIS6x-EXP-CUL1 and HIS6x-EXP-cul1-7 with GST-RBX1. HIS6x-EXP-CUL1 and HIS6x-EXP-cul1-7 proteins were translated in reactions supplemented with ∼500 ng of GST or GST-RBX1. Translations were incubated with glutathione-sepharose beads to collect GST-RBX1 complexes. Input represents 1% of the total for the autoradiogram and 4% for the anti-GST blot. Beads represents 75% of the total pull-down for the autoradiogram and 25% for the anti-GST blot. Inputs were normalized to either the amount of HIS6x-EXP-CUL1 translated with GST for the autoradiograph or the amount of GST-RBX1 in HIS6x-EXP-CUL1 translation for the anti-GST blot, and the amount in the pull downs were normalized to their respective inputs. The asterisk represents a nonspecific, cross-reactive band. A GST cleavage product that copurified with GST-RBX1 is also detectable in the GST-RBX1 lanes. (C) RBX1 immunoblot analysis. Western blot analysis using anti-ROC1 antisera was performed on total protein extracts. Each lane represents 120 μg total protein from week-old light-grown seedlings. (D) Co-immunoprecipitation of CUL1 and RBX1 from CUL1 and cul1-7 plant extracts. RBX1 was immunoprecipitated using 40 μg anti-ROC1 antibody from 5 and 10 mg total protein from CUL1 and cul1-7, respectively, to allow for more equal CUL1 input. Immunocomplexes were eluted from Protein A agarose and equal amounts were resolved by SDS–PAGE for Western blotting. Input represents 1% and 2% of the total for the anti-CUL1 and anti-ROC1 blots, respectively. cul1-7 input was normalized to CUL1 input, and the amount of co-immunoprecipitated cul1-7 was normalized to the amount of co-immunoprecipitated CUL1 as denoted by numbers at the bottom of the blot. (E) CUL1 and cul1-7 degradation. CUL1 protein degradation was examined in the7-day-old progenitor and cul1-7 lines. The zero time point represents a mock cycloheximide sample. Each lane represents 20 μg and 40 μg total protein for CUL1 and cul1-7, respectively. CUL1 levels and image quantification were determined as in Figure 7. Quantification denotes the amount of total CUL1 relative to 0 time point for the given genotype. Migration of molecular weight markers (sizes in kDa) is marked in A and C.

