
Figure 1.
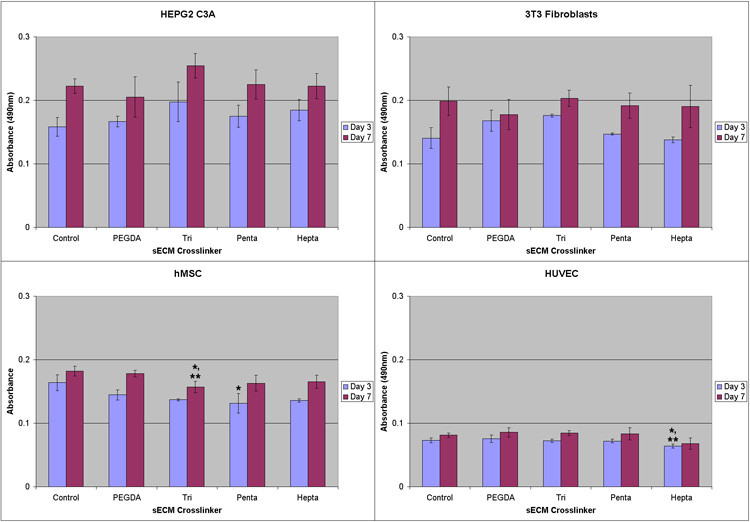
MTS absorbance readings on culture day 3 and 7. Clockwise from upper left: HEPG2 C3A hepatocytes; NIH 3T3 fibroblasts; hMSCs; HUVECs. Cells were encapsulated in sECM hydrogels using PEGDA, triblock PEGSSDA, pentablock PEG(SS)2DA and heptablock PEG(SS)3DA crosslinkers. One asterisk (*) indicates statistical difference relative to plastic control (p < 0.01) and two asterisks (**) indicate statistical difference relative to PEGDA control.