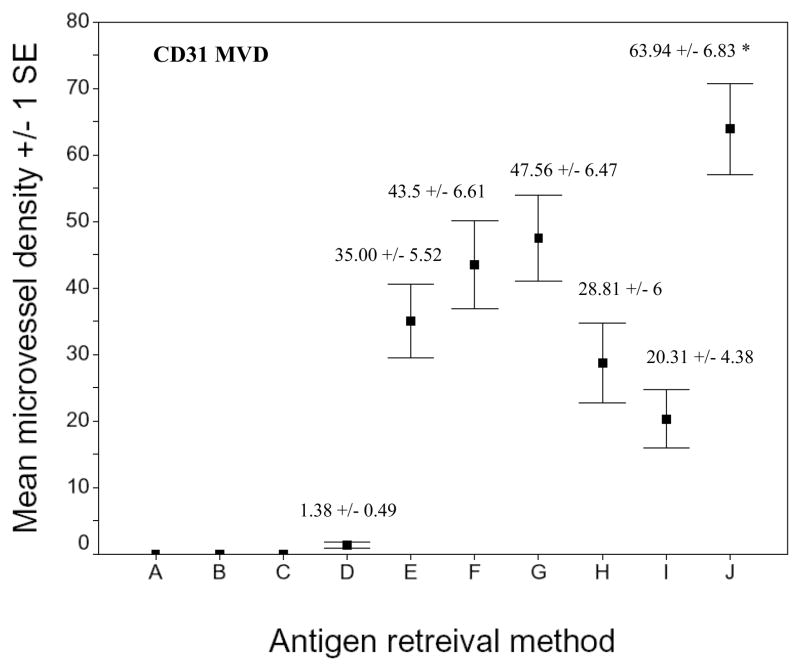
Fig. 2.
Microvessel density of CD31 stained sections of xenografts using different AR methods. A) No treatment. B) 0.1% trypsin. C) 0.05% pepsin. D) 0.01 M glycine (pH 3). E) 0.01 M sodium citric buffer (pH 6). F) 0.05 M borate buffer (pH 8). G) 0.01 M Tris-EDTA buffer (pH 9). H) AR10 solution (pH 10). I) 0.01 M Tris/0.05% Tween 20 (pH 10). J) 0.5 M Tris (pH 10). Asterisk indicates that the CD31 microvellel development seen with 0.5 M Tris (pH 10) was significantly greater than that obtained using the other AR methods (p < 0.01).

