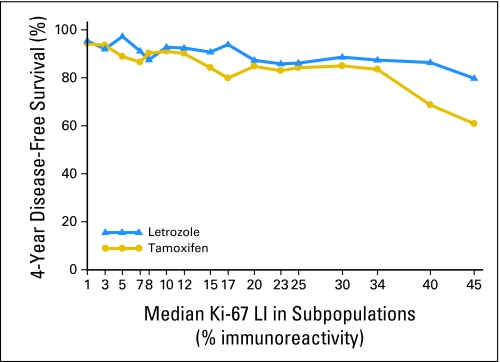
Fig 4.
Subpopulation Treatment Effect Pattern Plot analysis of the treatment effect of letrozole versus tamoxifen as measured by 4-year disease-free survival according to overlapping subpopulations defined by percentages of Ki-67 labeling index (LI). The x-axis indicates the median percentage of Ki-67 LI for patients in each of the overlapping subpopulations.

