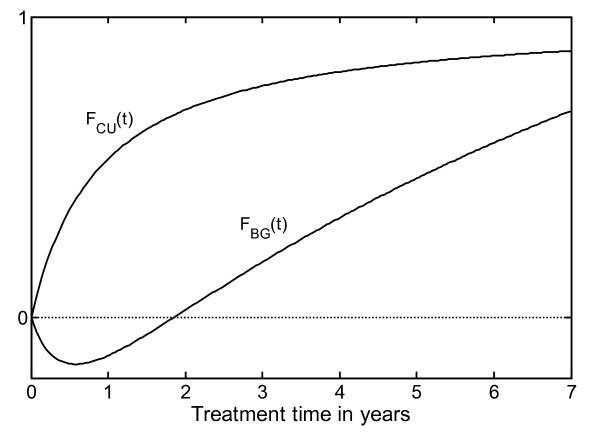
Figure 1.
Graphic illustration of the two equations that, when combined, produce the non-linear growth response curve. The hyperbolic equation FCU(t) can be regarded as a 'catch-up' equation, (by multiplying with the individual parameter MModel) asymptotically modulating individual amplitude with time. The "1" on the y-axis gives the asymptotic value of the FCU(t), and the Equation FBG(t) can be interpreted as a 'baseline growth' equation that introduces a delayed general growth response with a greater relative impact on individuals with low levels of catch-up growth than on individuals with high levels of catch-up growth.

