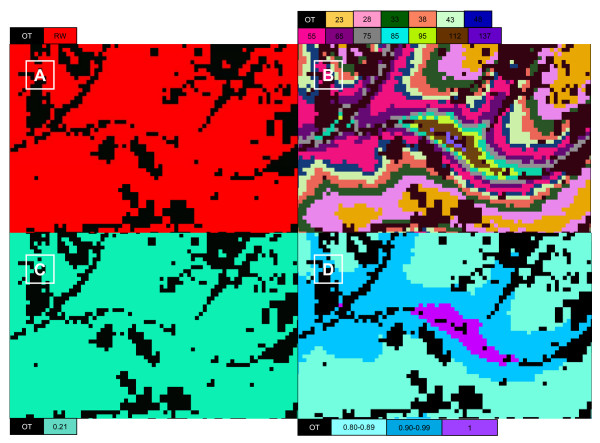
Figure 2.
Data layer processing. An example of data layer processing for a tract of Redwood forest. Each panel is representative of the same land area and is 2.2 km by 1.4 km in size. Panel A is the image classified to represent either redwood forest (RW) or other forest type (OT). Panel B is the mean fire return interval in years for each 30 meter pixel from the LANDFIRE data product. The mean fire return intervals in the panel range from 23 to 137 years. Panel C is the fire regime condition class departure index value from the LANDFIRE data product. Panel D is the relative carbon value, , for each pixel of redwood forest, incorporating the mean fire return interval and fire regime condition class departure data products. Multiplying the relative carbon value by the market value of carbon determines the risk scaled value of carbon for each pixel.

