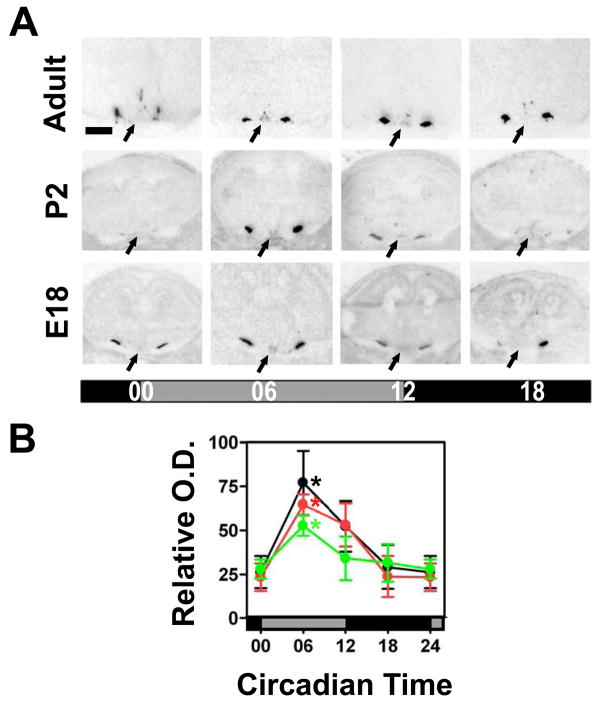
Figure 5. Avp mRNA expression in the SCN during ontogenetic development.
(A) Representative coronal sections showing the Avp hybridisation signal in the SCN (arrows) of fetal (E18), newborn (P2) and adult (6–10 week-old) C3H mice. Scale bar: 750 μm. (B) Relative optical density (O.D.) within the SCN region of fetal (green), newborn (red), and adult (black) C3H mice. Data are expressed as the mean +/− SEM of five animals per timepoint and ontogenetic stage. Data points at CT00/24 are double-plotted. Asterisks indicate significant differences between peak levels at CT06 and trough levels at CT00 (*p<0.05, one-way ANOVA).

