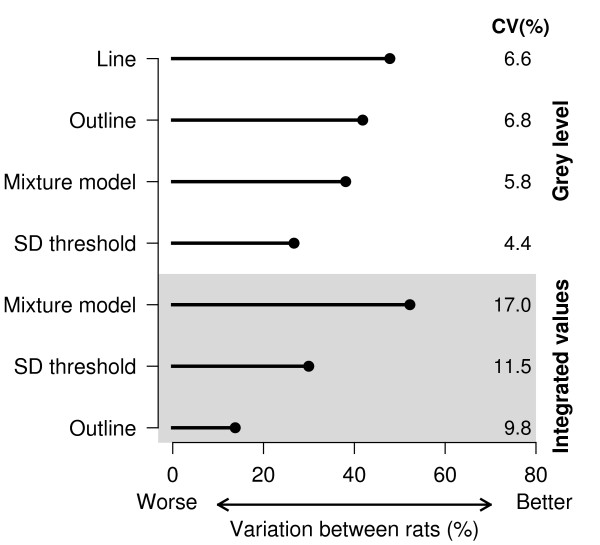
Figure 2.
Coefficients of variation and variance components analysis. The coefficients of variation are larger for the integrated grey level values than their non-integrated counterparts. This is due to the extra noise added when the GL value is multiplied by the area of the structure, which reduces the precision and statistical power of subsequent analyses. The two thresholding methods had the lowest CVs, but this may be due to a floor-effect. The line method captured the most biological variation (between rats) compared to the other non-integrated methods, although the outline and the mixture model method performed similarly.

