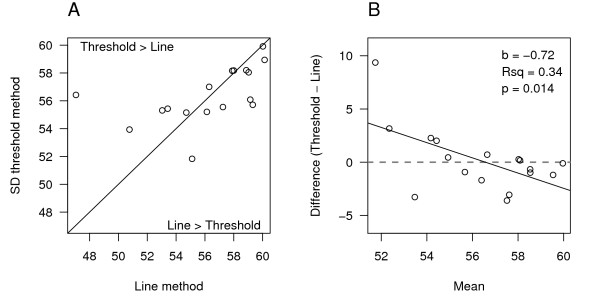
Figure 5.
Detection of a floor-effect. The average values for each rat obtained from the thresholding method (Method 3) and the line method (Method 1) are plotted (A). The black line is the line of identity (y = x) and points above the line are those for which the threshold method had larger values. A mean-difference plot is shown in (B), where values on the y-axis are the difference between the threshold and line methods, and on the x-axis the mean of the two methods. Points above the horizontal grey line had larger values with the threshold method, while points below the line had larger values with the line method. The significant slope (b) indicates that the threshold method gives higher values then the line method at lower GL values, which is what would be predicted if there is a floor-effect.

