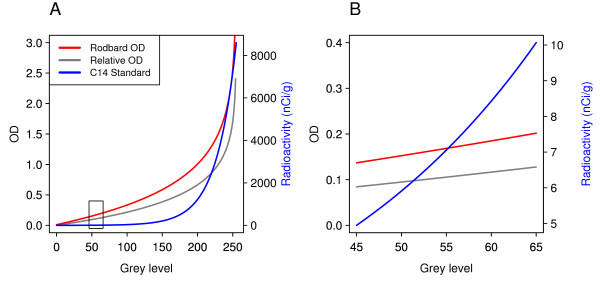
Figure 6.
Transformation of grey levels. Grey levels from 0 to 255 were transformed using three different methods (A). The uncalibrated relative OD and the Rodbard OD method are plotted on the left y-axis, while transformation with the 14C-standard uses the right y-axis. The box indicates the range of observed grey level values in this dataset and are re-plotted in (B). All three methods give different curves, however within the range of actual values, the transformation is fairly linear, especially for the relative and Rodbard OD transforms.

