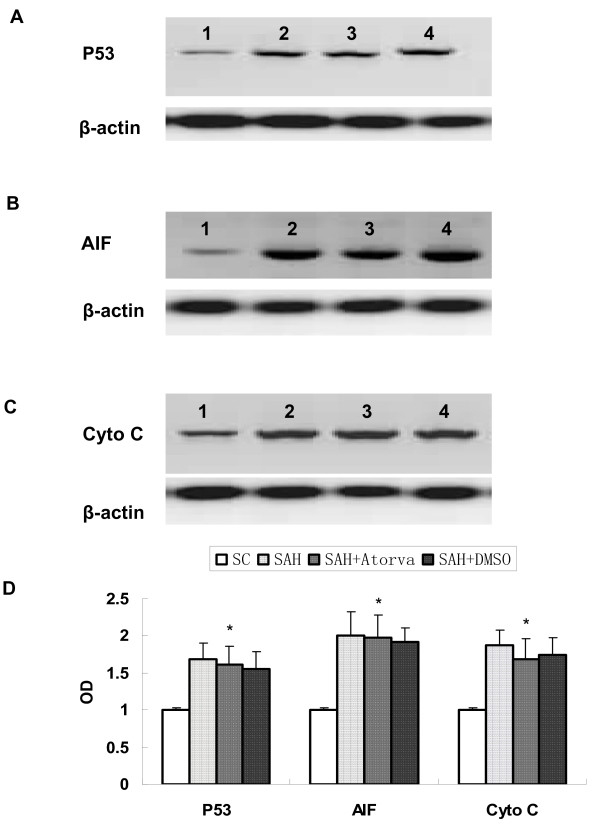
Figure 4.
Represent Western blot for expression of P53 (A), AIF (B), and Cytochrome C (C) in brain cortex. Obvious increase of these apoptosis-related proteins was observed after SAH, while they were not affected by atorvastatin-treatment. Each column represents 5 independent experimental results (D). (1, Sham operated control; 2, SAH; 3, SAH+Atorvastatin; 4, SAH + DMSO. *, P = ns vs DMSO group).

