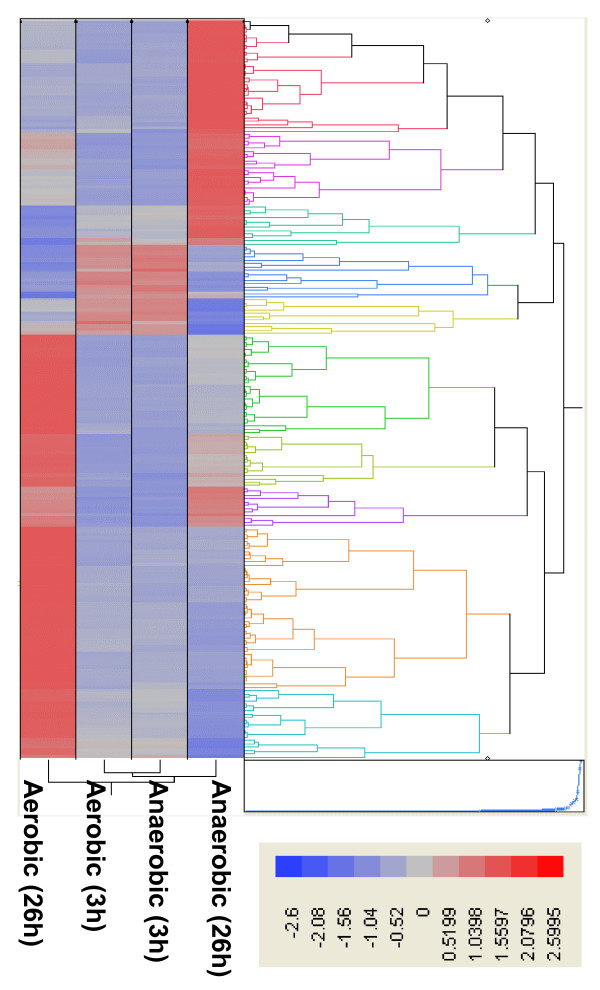
Figure 4.
Hierarchical cluster analysis of significantly differentially expressed ZM4 genes for aerobic and anaerobic fermentations at 3 and 26 h. Gene expression values were clustered based on their log2 based expression values using JMP Genomics 3.0. Negative numbers (colored blue) indicates less relative gene expression aerobically, and positive numbers (colored red) indicate greater relative gene expression anaerobically.

