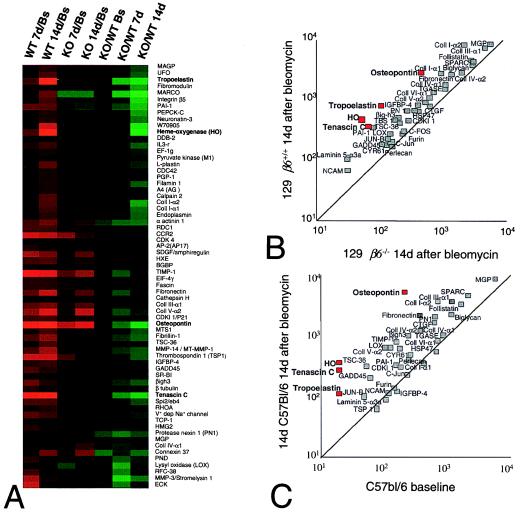
Figure 2.
(A) Enlargement of Cluster B from Fig. 1 of genes that were not different at baseline and were induced preferentially in wild-type mice. The name of each gene is shown to the right of each row. Genes shown in bold text were induced more than 8-fold in response to bleomycin. (B) Because many of the genes in cluster B had been previously shown to be induced by TGF-β, expression of 53 known TGF-β-inducible genes was compared 14 days after bleomycin treatment in β6−/− mice (x axis) and wild-type (β6+/+) mice (y axis). Genes induced at least 8-fold by bleomycin are shown bold in these panels, and the mean intensity values are shown by red boxes. The middle diagonal in B and C is the line of identity. (C) Comparison of expression of the same 53 TGF-β-inducible genes at baseline (x axis) and 14 days after bleomycin (y axis) in wild-type C57BL/6 mice.

