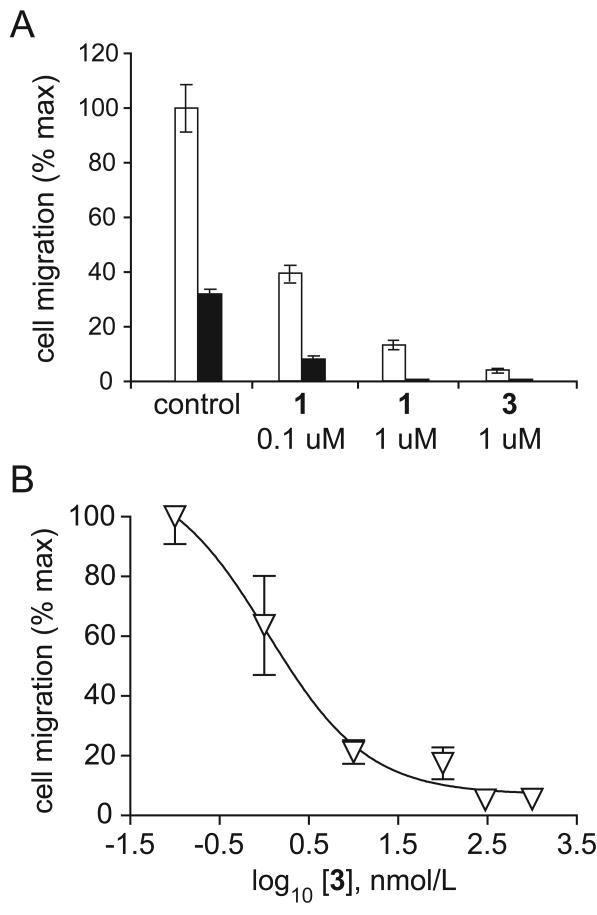
Figure 2.
Inhibition of cell migration by 1 and 3. (A) Inhibition of HGF-stimulated (50 ng/mL; white bar), or unstimulated (black bar) PC3M cell migration by 1 and 3. Values represent mean number of migrated cells per 10× microscopic field, expressed as percent maximum, +/- standard deviation. (B) Dose-response analysis of inhibition of PC3M cell migration by 3.

