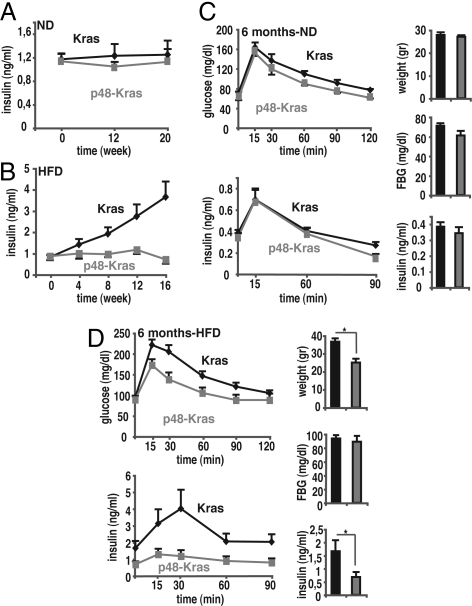
Fig. 2.
HFD enhances tumorigenesis independent of insulin resistance. (A and B) Nonfasting plasma insulin values for p48-Kras mice and Kras control littermates kept on (A) a ND and (B) a HFD. (C) GTTs were performed in 6-month-old female p48-Kras mice and Kras control littermates on a ND. Insulin response curve during GTT together with corresponding weight, fasting glucose, and insulin values during the test are shown. (D) Glucose clearance and insulin response curve during GTT in 6-month-old female p48-Kras mice and Kras control littermates on the HFD are shown with corresponding weight, fasting glucose, and insulin values during the test. Data are mean values ± SEM. n = 5–7 mice per genotype. *, P ≤ 0.05.

