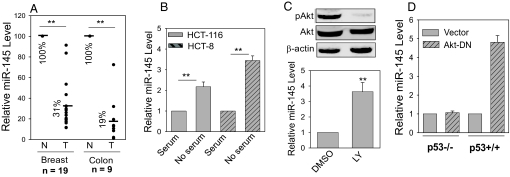
Fig. 1.
Expression of miR-145 through the Akt and p53 pathways. (A) Expression of miR-145 in the matched breast and colon tumor specimens, respectively. In breast tumor tissue, the average level of miR-145 was 31% of that in the matched normal tissue; in colon tumor tissue, the corresponding number was 19%. (B) Induction of miR-145 by serum starvation. Cells (HCT-116 and HCT-8) were grown in the medium containing 10% or no FBS for 24 h. (C) Induction of miR-145 by PI-3K inhibitor LY294002. HCT-116 cells were treated with 50 μM LY294002 for 16 h. (D) Dominant negative Akt (Akt-DN) induces miR-145 expression. HCT-116 cells were transfected with vector alone (pCMV) or Akt-DN for 24 h. Values in B–D are means ± SE of 3 separate experiments and normalized to their respective controls as 1. **, P < 0.01.

