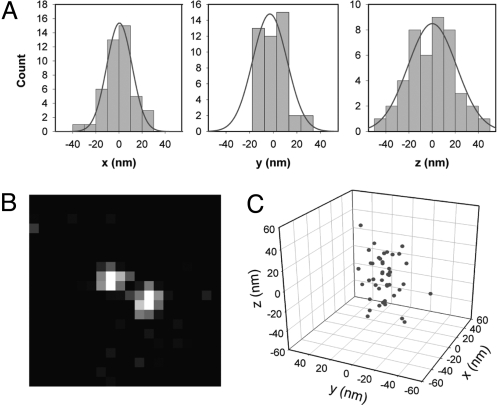
Fig. 2.
3D localization of a single molecule. (A) Histogram of 44 localizations of one single photoactivated DCDHF-V-PF4 molecule in x, y, and z in a layer of PMMA. The standard deviations of the measurements in x, y, and z are 12.8, 12.1, and 19.5 nm, respectively. The smooth curve is a Gaussian fit in each case. An average of 9,300 photons were detected per estimation on top of background noise fluctuations of 48 photons per pixel. (B) Representative single-molecule image with DH-PSF acquired in one 500-ms frame. (C) Localizations plotted in 3 dimensions.

