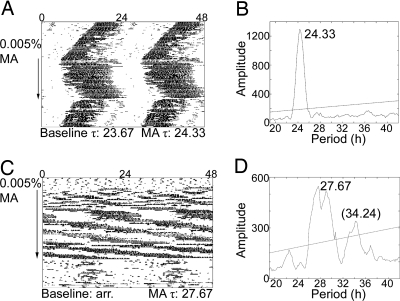
Fig. 4.
Npas2−/− mice on methamphetamine (MA). Sample actograms (A and C) and periodograms (B and D) from an intact Npas2−/− mouse (A and B) and an SCNX Npas2−/− mouse (C and D). Actograms are double plotted. The arrow indicates the period of drug administration (0.005% methamphetamine). τ in h is listed along the bottom of each actogram. Baseline τ was calculated in DD before drug administration. Methamphetamine τs were calculated using the last 2 weeks of drug treatment and are represented in the periodograms (B and D). A significant peak is observed at 24.33 h for the intact mouse (B). Methamphetamine use significantly lengthened τ in intact Npas2−/− mice (t = −4.384, P < 0.05). The SCNX animal had no significant free-running period in DD before drug administration; however, note the weak 24-h rhythm following methamphetamine removal. During methamphetamine treatment a significant peak is observed at 27.67 h with a smaller peak at 34.24 h (D).

