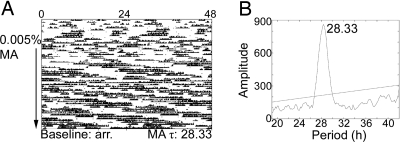
Fig. 5.
Per1−/−/Per2−/− mice on methamphetamine (MA). Sample actogram (A) and periodogram (B) from a Per1−/−/Per2−/− mouse. The actogram is double plotted. The arrow indicates the period of drug administration (0.005% methamphetamine). τ in h is listed along the bottom of the actogram. Methamphetamine τ was calculated using the last 2 weeks of drug treatment and is represented in the periodogram (B). A significant peak is observed at 28.33 h.

