Fig. 6.
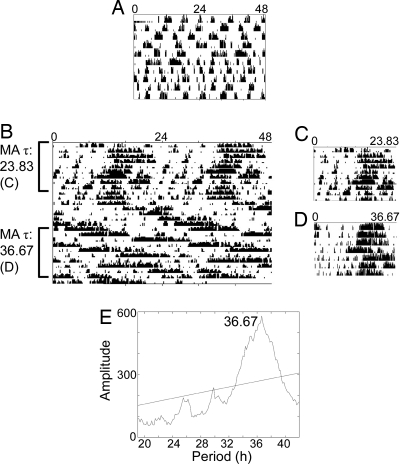
Bmal1−/− mouse on methamphetamine (MA). Double-plotted actogram from a Bmal1-knockout mouse depicting infrared activity data before methamphetamine treatment (A) and in the initial period of 0.005% methamphetamine water administration (B). The first day of the actogram in (B) is the first day of 0.005% methamphetamine availability; before that point the animal was consuming 0.0035% methamphetamine water. The τ in h is listed along the side of the actogram. The abrupt change in period that occurred toward the middle of the record was spontaneous. (C) A single-plotted actogram of the initial period of 0.005% methamphetamine treatment (when the observed τ was 23.83 h). The x-axis has been changed to 23.83 h to aid in visualizing rhythmicity. (D) A single-plotted actogram of the latter portion of (B) with the x-axis changed to 36.67 h to aid in visualizing rhythmicity. (E) Periodogram analysis from this mouse after ≈2.5 weeks of 0.005% methamphetamine treatment. This periodogram covers the last 10 days of the record shown in (B); a significant peak is observed at 36.67 h.

