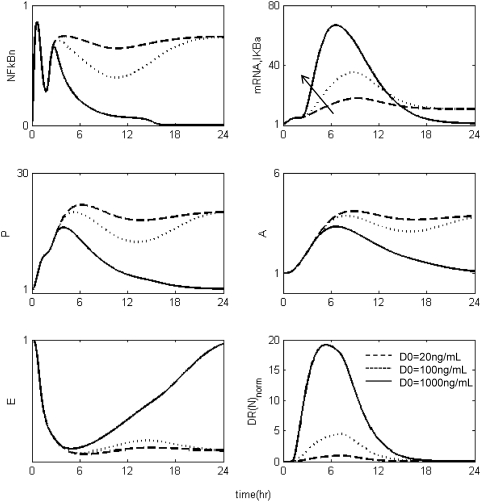
Figure 12. Dose-dependent modulation in the progression of the inflammatory response due to corticosteroids initiating infusion at t = 1 hr and for 6 hr post-endotoxin administration at multiple doses (D0).
The solid arrow illustrates the mode of corticosteroid action via up-regulation of mRNA,IkBa. Solid lines (-) characterize a resolution in the inflammatory response while dashed lines (--) and dotted (…) correspond to lower drug doses that does not regulate properly the aberrant activity of NFkB if the intervention is initiated after the endotoxin challenge. The DR(N) profile that corresponds to the lower drug dose, D0 = 20 ng/mL, constitutes the basis active signal normalized to (0,1) values, while the active signals for larger doses are scaled with respect to the lowest drug dose.

