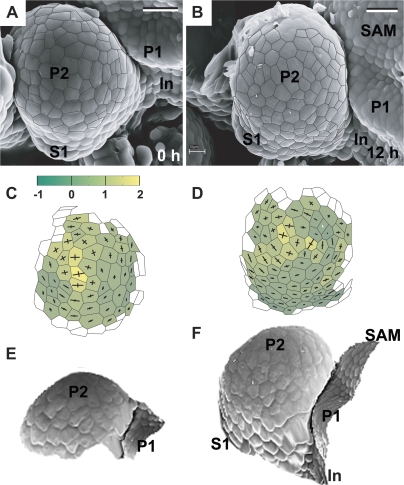
Fig. 10.
Flower primordium in a sepal formation stage. Scanning electron micrographs (A, B), curvature plots (C, D), and side views of the reconstructed surface (E, F) show the portion of periphery of the clv3-2 inflorescence shoot apex No. 3, different from the portion shown in Fig. 5. Sepal primordium (S1) and a putative internode surface (In) are labelled. Bars=20 μm. (This figure is available in colour at JXB online.)

