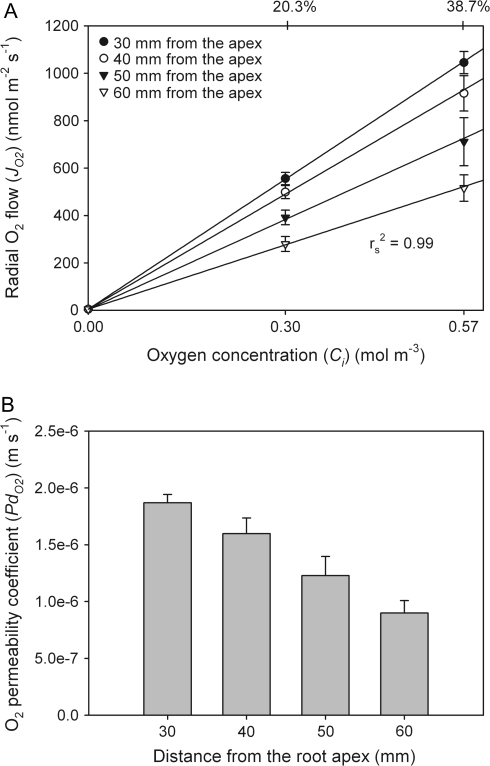
Fig. 7.
(A) Because of limitations of the technique in the range of high O2 concentrations (see Fig. 6), only the initial slopes (0–38.7% of O2) of JO2/Ci curves were used to calculate permeability coefficients of oxygen (PdO2). (B) The highest values of PdO2 were close to the root apex and decreased along the root, which is most probably due to suberization and/or lignification of roots. Data given are means ±SE (n=5).

