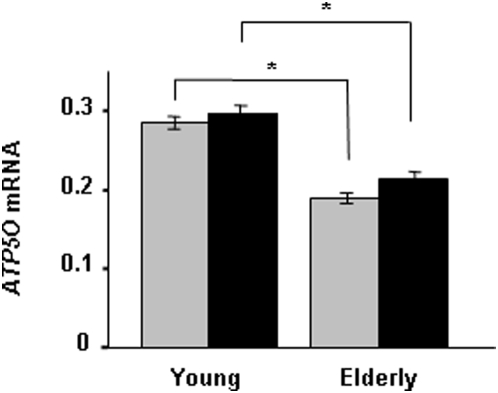
Figure 2. Age associates with ATP5O mRNA expression in skeletal muscle from young (n = 86) and elderly (n = 69) twins.
Presented values are ratios between the mRNA expression of ATP5O and the endogenous control cyclophilin A, which was calculated for each sample and expressed as mean±SEM. Grey bars, before; and black bars, after a hyperinsulinemic euglycemic clamp. *p<0.05.

