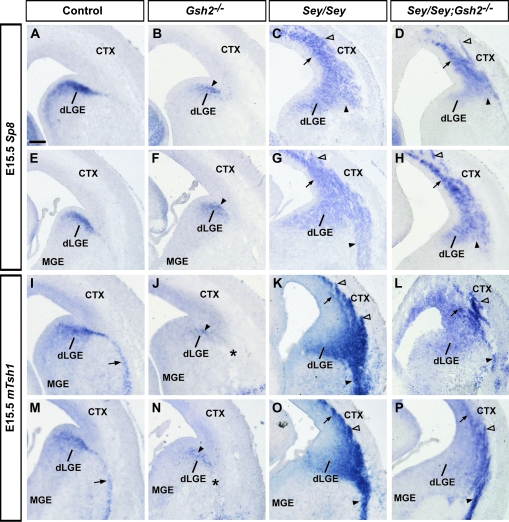
Figure 3.
Expression of dLGE markers Sp8 and mTsh1 at E15.5. At E15.5, Sp8 strongly marks the dLGE SVZ (A, E). In Gsh2 mutants, this expression pattern is largely normal (B, F, arrowheads).Sey mutants display significant ectopic expression of Sp8 in the pallium (C, G, arrows), with an enlarged basal stream at more medial levels (G, arrowhead) that is not observed more rostrally (C, arrowhead). Sey/Gsh2 double mutants display ectopic pallial expression, though at diminished levels from the Sey mutants (D, H, arrows), with nascent paraventricular ectopia (D, H, empty arrowheads). Sey/Gsh2 double mutants also do not display a basal stream of Sp8 expression (D, H, arrowheads). mTsh1 is expressed in the dLGE SVZ and putative LCS (arrows) (I, M). In Gsh2 mutants, there is diminished mTsh1 in the dLGE SVZ (arrows) with a lack of expression in the putative LCS (J, N, asterisk). In the Sey mutant, ectopic mTsh1 expression is found in the pallium (arrows) and forms paraventricular ectopia (empty arrowheads) (K, O). Basal-directed putative migration is observed at rostral (K, arrowheads) and medial (O, arrowheads) levels. Sey/Gsh2 double mutants also exhibit pallial ectopic mTsh1 expression (arrows) with paraventricular ectopia (empty arrowheads) and putative basal-directed migration (arrowheads) (L, P). n numbers for each probe are as follows: controls, n= 6 [Sp8], n= 6 [mTsh1]; Gsh2−/−, n= 5 [Sp8], n= 5 [mTsh1]; Sey/Sey, n= 5 [Sp8], n= 6 [mTsh1]; Sey/Sey;Gsh2−/−, n= 4 [Sp8], n= 5 [mTsh1]. Scale bar: 200 μm.

