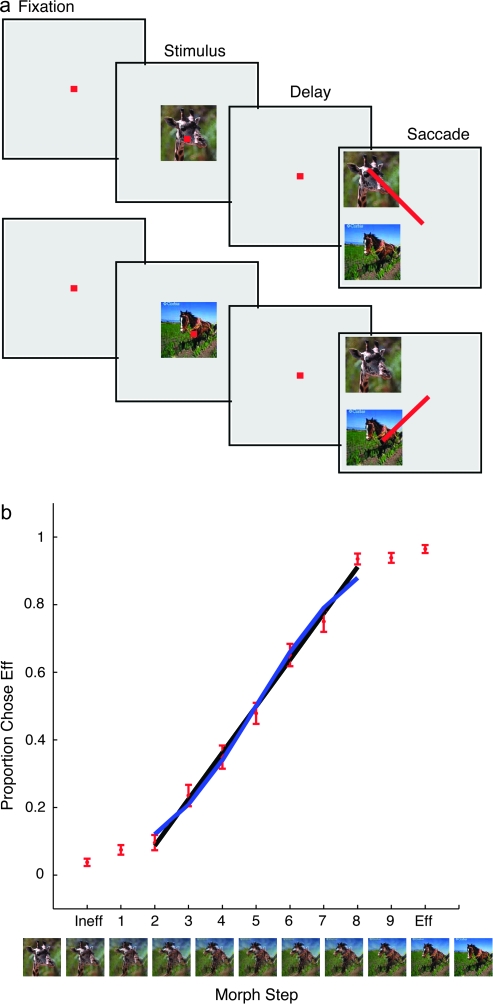
Figure 1.
(a) Classification task. After the monkey achieved fixation on a fixation point, a sample, chosen at random among the 9 morphed images or the pair of photographs from which the morphs were made, was presented for 320 ms. Then, after a delay, the photographs appeared together as possible choices (targets). The monkey's task was to pick the target choice that more closely resembled the sample, and make a saccade to it. (b) Behavioral performance. The data are plotted as the proportion of times the monkey chose one of the images (the “effective” image for the cell (see Methods), or Eff) of the 2 original photographs, as a function of the different samples. The trend is linear in the central region between morphs 2 and 8, but performance levels off at the extremes and their nearest neighbors, images Ineff (0) to 2 and 8 to Eff (10). The data are fit with a sigmoid (blue line) and a line (black line). Error bars are standard errors of the mean across different sessions. Images are examples used in one session, where the giraffe was the Ineff image, and the horse the Eff image.

