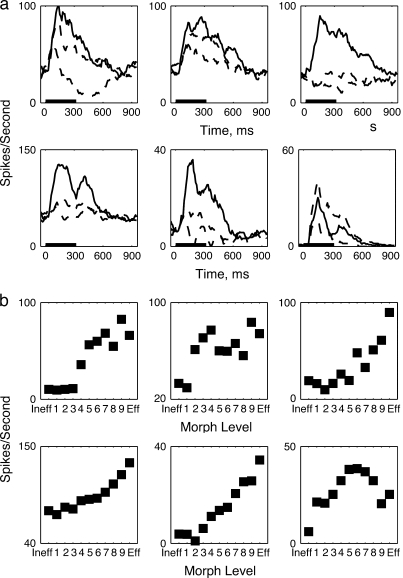
Figure 2.
Single cells show a variety of neural responses to different morphed images. (a) Response time course of 6 different cells to the 2 end point images Eff (black) and Ineff (black dashed) and to the midlevel morph (blue dashed). (b) Firing rates to the Eff and Ineff and 9 morph variants computed over time period 100–200 ms. The black horizontal line shows the period of sample presentation (320 ms).

