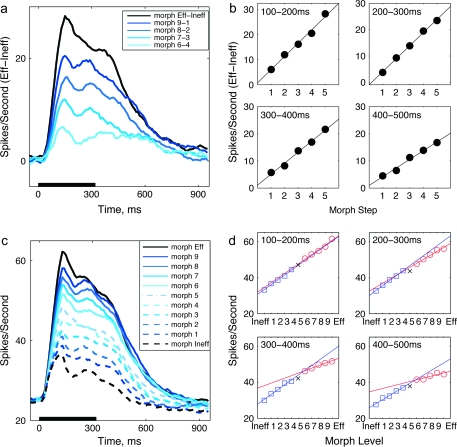
Figure 3.
Time course of population responses to morphed images. (a) Time course of average differences between the responses to images Eff and Ineff (black) and to morphs successively different from the images (Eff & Ineff) between which they were morphed, averaged across the population of cells n=128. In both panels, as in Figure 2 spike counts are binned into 100 ms bins, which slide every 10 ms from stimulus onset, and are averaged across 15–20 trials per unit and morph step. (b) Mean response difference between Eff and Ineff morphs in successive 100 ms epochs after sample onset. (c) Time course of firing rate to Eff and Ineff, and each morph variant, as in (a). (d) Mean response to Eff and Ineff image and morph variants in successive 100 ms epochs as a function of morph level.

