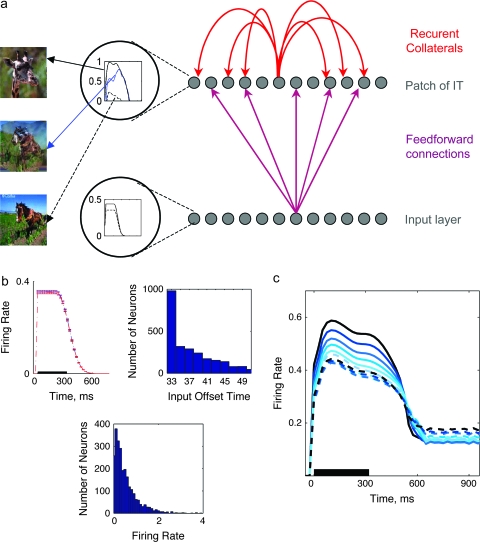
Figure 6.
(a) Schematic view of the simulated network, including an input layer, which projects its activity to an output layer (recurrent connections) through sparse FF connections. Different units in first layer receive input, generated using a common truncated logarithmic distribution (b, bottom middle), with durations drawn at random from a logarithmic distribution (b, top right); one example is shown in circle at bottom. The units in this layer are active at a certain level for a specific duration, with a gradual transition to zero (example shown in circle at top). (b) Simulated input activity pattern: the average activity across all of the input units, for one pattern, is shown in top left; distribution of input offset times in top right, and firing rates in bottom middle. (c) Average network activity, in response to morphs obtained between 2 nonstored patterns, including a linear decay of firing frequency. Because there are no stored patterns, no attractors appear in this simulation.

