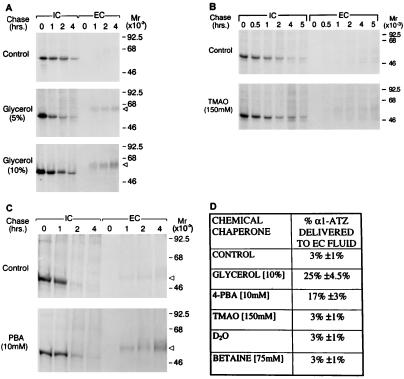
Figure 1.
Effect of chemical chaperones on secretion of α1-ATZ. CJZ12B cells (7, 8) were preincubated in control medium or medium supplemented with the designated drug as described in Materials and Methods. Cells were then subjected to pulse-chase radiolabelling, and the results were analyzed by immunoprecipitation followed by SDS/PAGE/fluorography. Molecular mass markers (in kDa) are shown on the right. The relative electrophoretic migration of the 55-kDa α1-ATZ polypeptide in the EC is indicated on the right by a triangular arrowhead. (A) CJZ12B cells incubated for 12 h in the absence or presence of 5 or 10% glycerol. (B) CJZ12B cells incubated for 12 h in the absence or presence of 150 mM TMAO. (C) CJZ12B cells incubated for 12 h in the absence or presence of 10 mM PBA. (D) Summary table of results from treatment of CJZ12B cells with several chemical chaperones. The data are expressed as percent α1-ATZ delivered to the EC after a 4-h chase, compared with the total α1-ATZ newly synthesized at t = 0 IC, as determined by densitometric analysis of gels. In each case, the pulse-chase experiment from the control and experimental conditions were exposed on the same film and a similar amount of α1-ATZ was present at t = 0 IC in the control and experimental conditions. Values represent the means ± 1.0 SD for the percent of α1-ATZ delivered to EC from three independent experiments in each case. The range of values for the control was 2.0–3.9%; glycerol, 23.0–27.2%; PBA, 15.0–18.4%; TMAO, 2.0–4.0%; D20, 2.0–4.0%; and betaine, 1.9–3.9%. Results were similar when phosphorimaging analysis was used to quantify results in two separate experiments for glycerol and PBA (data not shown).

