
Figure 4. Associations Between Blood Markers and Plantarflexion Strength in Participants With PAD.
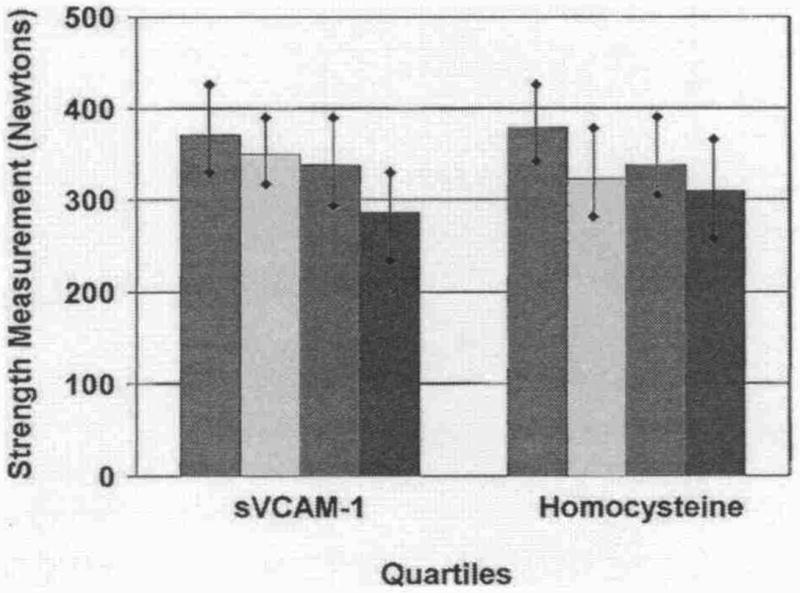
Data are adjusted for age, gender, race, cigarette smoking, body mass index, leg symptoms, ankle-brachial index, recruitment cohort, comorbidities, total cholesterol, high-density lipoprotein cholesterol, and statin use (C-reactive protein only) (n = 403). Red bars = first quartile; yellow bars = second quartile; green bars = third quartile; blue bars = fourth quartile. Abbreviations as in Figure 1.