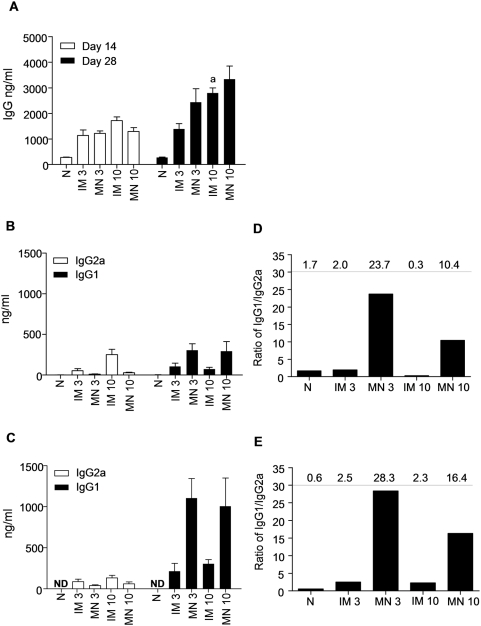
Figure 3. Total anti-influenza serum IgG and isotype profiles after intramuscular (IM) and microneedle (MN) immunization with 3 µg or 10 µg of inactivated influenza virus compared to naïve control group (N).
(A) Total serum IgG titers determined on days 14 and 28 after immunization. (B) Serum IgG2a and IgG1 isotypes on day 14 and (C) Serum IgG2a and IgG1 isotypes on day 28. (D) Ratio of IgG1/IgG2a on day 14 (E) Ratio of IgG1/IgG2a on day 28. All IgG measurements were made by quantitative ELISA (average±s.e) ap<0.05 when IM 10 µg compared to the IM 3 µg group.

