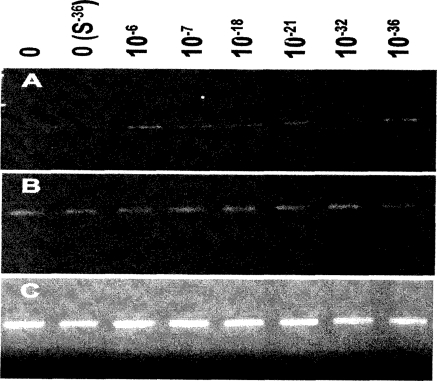
Figure 4.
Effect of low-does Cd on mRNA expression of MT-1G, Hsp 70, and GAPDH in RWPE-1 cells as analyzed by RT-PCR. Representative picture showing PCR products from cells treated with low and ultralow doses of Cd for 20 weeks. (A) Increased levels of MT-1G mRNA (2- to 3-fold) and densitometric analysis from three experiments show no significant difference between Cd-treated specimens (data not shown). (B) No significant changes were observed in Hsp 70 levels. (C) Equal amounts of RNA were checked by analyzing GAPDH expression.

