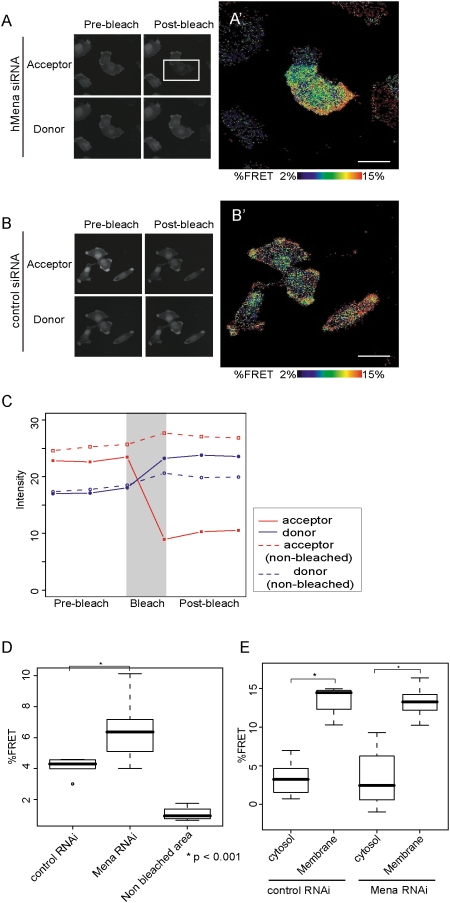
Figure 7. Imaging of Rac activity in U251MG cells using a u-adFRET assay.
U251MG cells co-transfected with Raichu-Rac and hMena siRNA or control siRNA were replated onto glass-bottom dishes. YFP and CFP images were obtained from spectral images using the linear unmixing method. Expression patterns of YFP (acceptor) and CFP (donor) of Raichu-Rac1 before (A, B, left panels) and after (A, B, right panels) acceptor photobleaching. Bleached area indicated with a rectangle in A. In the control cells, the whole area in B is photobleached. (A', B') Mapping of FRET efficiency. In hMena knock-down cells, Rac1 was activated in an extended arc-like structure which corresponds to the lamellipodia (A'). In control cells, Rac1 was also activated at the protrusive ruffling membrane (B'). Bars, 20 µm. (C) Example profiles of fluorescence of donor (blue) and acceptor (red) before and after photobleaching. Dashed lines indicate the change of the fluorescence within the non-bleached area. (D) Box and whisker plots for mean FRET efficiency of U251MG cells. (E) Box and whisker plots for regional FRET efficiency in U251MG cells. For the box and whisker plots, top and bottom of the box represent the 75th and 25th quartile, and whiskers 10th and 90th percentiles, respectively. The middle line of the box is the median. Data is from 20 cells each. Brackets with asterisks indicate statistically significant differences between data sets from a Student's t test (p<0.001).

