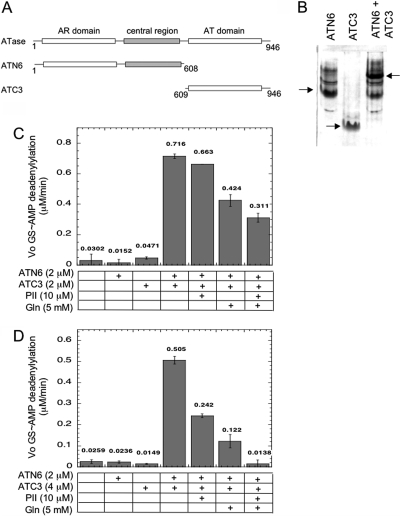
Figure 2.
Reconstitution of the AR activity of ATase. (A) Schematic depiction of the domains comprising the ATC3 and ATN6 polypeptides. The numbers refer to the first and last amino acid residues in each species using the codon numbers for the wild-type full-length protein. (B) Nondenaturing 14% polyacrylamide gel electrophoresis of polypeptides in isolation and combination. Conditions for gel electrophoresis lacked any known regulators of ATase but included 1 mM MgCl2. Arrows indicate the position of the major ATN6 and ATC3 bands, as well as the position of the complex between these polypeptides. Each sample contained the indicated polypeptides at 6 μM each. Samples were incubated for 10 min at room temperature to allow the formation of complexes, prior to electrophoresis at 4 °C. (C) Reconstitution of the AR activity from the ATC3 and ATN6 polypeptides using an ATP-regenerating system to remove ADP. The initial rate of GS-AMP deadenylylation was measured as described in , with GS-AMP at 8 μM, PII-UMP at 5 μM, ATP at 1 mM, α-ketoglutarate at 1 mM, KPi at 1 mM, pyruvate kinase at 0.022 unit/μL, and PEP at 5 mM. (D) Reconstitution of the AR activity from the ATC3 and ATN6 polypeptides using the noncleavable analogue AMP-PNP in place of ATP. The initial rate of GS-AMP deadenylylation was measured as described in , with GS-AMP at 16 μM, PII-UMP at 5 μM, α-ketoglutarate at 1 mM, KPi at 1 mM, and AMP-PNP at 1 mM.

