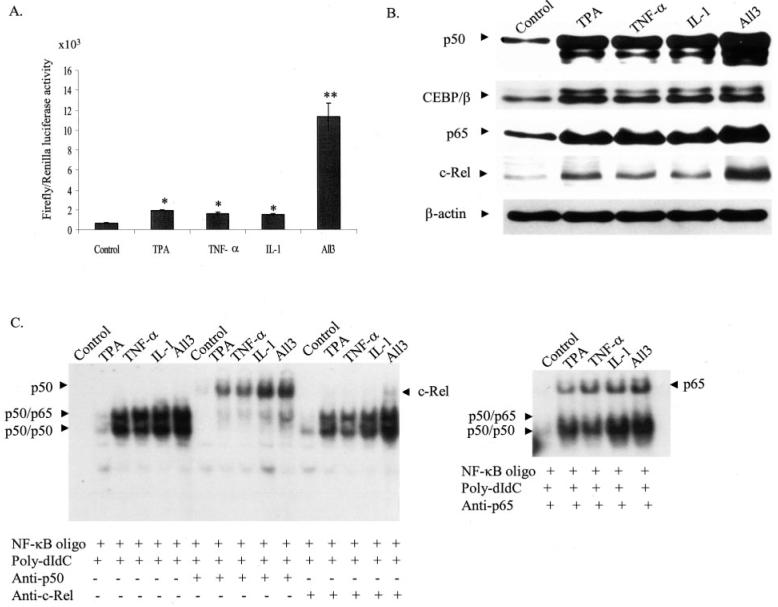
Fig. 1. Induction of MnSOD gene transcription after treatment of PMA and cytokines.
A, subconfluent HepG2 cells were transiently transfected with MnSOD promoter- and enhancer-driven pGL3 reporter vectors along with Renilla (pRL-TK) luciferase vector as an internal control. Eight hours after transfections, cells were washed with 1x PBS and incubated at 37 °C for 24 h. At 12 h after treatment of PMA and cytokines, cell lysates were collected. Reporter activity was determined as a measure of MnSOD gene transcription by relative chemiluminescent light units. B, nuclear extracts were collected from HepG2 cells and the levels of p50, p65, CEBP/β, and c-Rel in HepG2 cells after treatment of PMA or cytokines or in combination for 4 h was determined by Western blotting analysis. Equal amounts of nuclear extracts (50 μg) were subjected to 10% SDS-polyacrylamide gel electrophoresis, and Western analysis was performed using antibodies specific to p50, p65, CEBP/β, and c-Rel. The same membrane was re-probed with a β-actin antibody used as the loading control. C, NF-κB DNA binding reactions were carried out as described under “Experimental Procedures.” For supershift experiments nuclear extracts were preincubated with 1 μg of an antibody specific to p50, p65, and c-Rel prior to the binding reaction. DNA binding complexes and supershift complexes are indicated by the arrows. Each data point represents the mean of three independent experiments mean ± S.D. Significant difference from control: *, p < 0.05, and **, p < 0.01.

