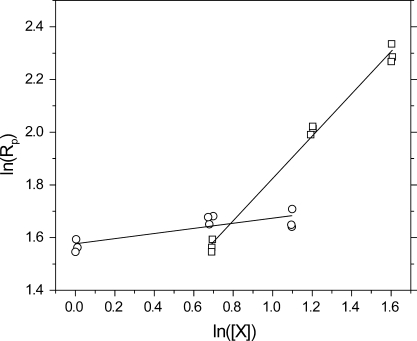
Figure 5.
Log−log plot of initial polymerization rate versus initial concentration of thiol (◻, at 1.0 M alkyne) and alkyne (○, at 2.0 M thiol). Samples were formulated with 0.0490 M Irgacure 184 and irradiated at 365 nm, 30 mW/cm2. The respective reaction orders are denoted by the slope of the lines of best fit.

