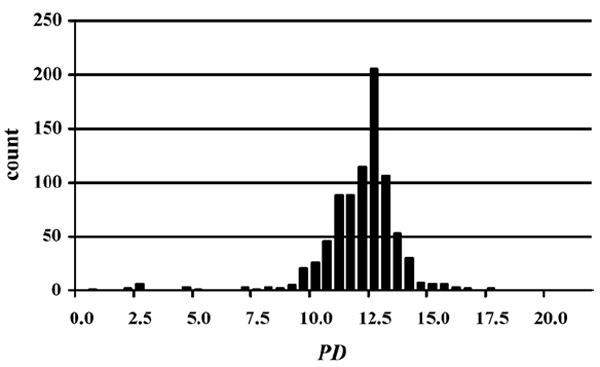
Fig. 1.

Distribution of the PD values of all peptide segments for all allergens in SDAP relative to epitope 4 from Jun a 1, where only the lowest PD value per sequence was retained. The average value of this distribution is 11.72 and the standard deviation is 1.71.
