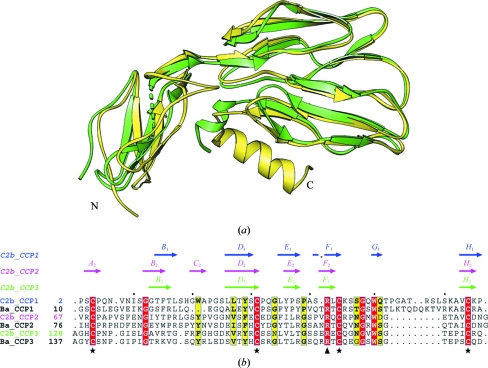
Figure 5.
Comparison of the N-terminal fragments of C2 and factor B. (a) Superposition of the Ba segment of factor B (yellow) and C2b (green). (b) Structure-based sequence alignment (plotted with ESPript) of the CCPs of C2b and Ba. A schematic summary of the secondary structure (labeled arrows) of β-strands is shown at the top as determined for the CCPs of C2b using the program DSSP (Kabsch & Sander, 1983 ▶). The invariant Cys and uncommon highly conserved Arg residues are marked with stars and triangles at the bottom.

