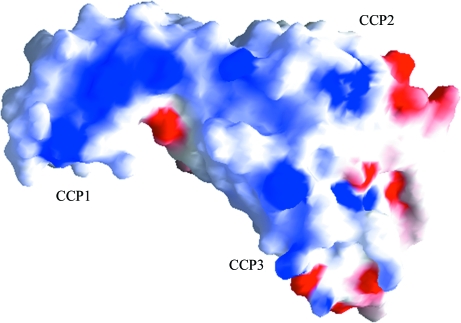
Figure 7.
Electrostatic surface representation of C2b. The surface-charge distribution was calculated using GRASP (Nicholls et al., 1991 ▶). Positively charged regions are represented in blue, negatively charged regions are represented in red and both polar and nonpolar regions are represented in white.

