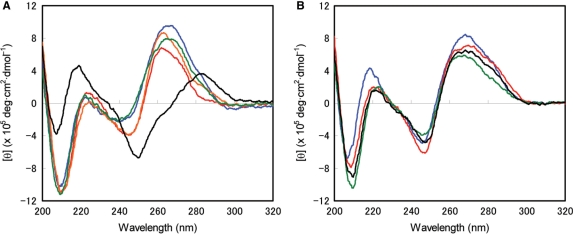
Figure 4.
(A) CD spectra of BNACOC duplex 27/30 (red line), BNACOC/RNA heteroduplexes 27/29 (orange line) and 26/30 (green line), DNA duplex 25/28 (black line), RNA duplex 26/29 (blue line); (B) CD spectra of duplexes the BNACOC/DNA heteroduplexes 27/28 (red line) and 25/30 (green line) and DNA/RNA duplexes 25/29 (black line) and 26/28 (blue line). The spectra were recorded in 10 mM sodium phosphate buffer (pH 7.2) containing 100 mM NaCl at 12°C. The concentration of each strand was 4 μM.

