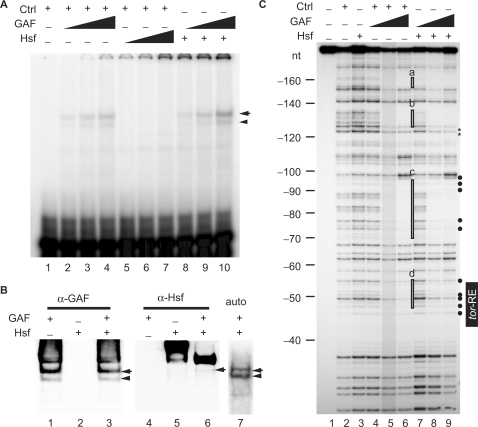
Figure 3.
Hsf alters the DNA-binding property of GAF. (A) EMSA was performed using a 25-bp 32P-labeled probe with various amounts of proteins. The volume of the control was 2 μl (lanes 1–7). Various volumes of Hsf (1.25, 2.5 and 5 μl in lanes 5–7; 5 μl in lanes 8–10) and GAF (1, 2 and 4 μl in lanes 2–4 and 8–10) were used. The DNA–protein complexes were separated in a 4% polyacrylamide gel and detected using a PhosphoImager (GE/Amersham Biosciences). An arrow head and arrow indicate the tor-RE bound by a monomer and dimer, respectively. (B) Shift-western blotting of the complexes formed with GAF (4 μl in lanes 1, 3, 4, 6 and 7), Hsf (5 μl in lanes 2, 3, 5, 6 and 7) and the labeled probe. Quantity of the probe was 5-fold higher than that used in EMSA. GAF and Hsf on the nitrocellulose membrane were detected by immunoblotting with anti-GAF and Hsf antibodies, respectively. The ‘auto’ represents an autoradiogram that shows position of the radiolabeled probe on the nylon membrane. The DNA–protein complexes indicated by an arrow and arrow head are the same as those shown in (A). (C) DNaseI footprinting was used to show where Hsf, GAF or GAF/Hsf binds in the tll-MRR. The control is proteins extracted from bacteria carrying the pET28a vector. The protein concentrations of the control, GAF and Hsf proteins determined by the Bio-Rad protein assay (Bio-Rad Laboratories, Inc.) are 2.24, 1.75 and 0.34 mg/ml, respectively. Various amounts of proteins were incubated with the probe in a final volume of 50 μl. The reaction mixture was incubated at room temperature for 10 min. A constant volume of control (2 μl in lanes 2 and 4–6) and Hsf (10 μl in lanes 3 and 7–9) were used, whereas various volumes of GAF (1, 2 and 4 μl; represented by triangles) were used (lanes 4–6 and 7–9). Brightness of lane 5 is reduced by 15%. Regions protected by GAF alone are highlighted by open rectangles (a–d) at the right of lane 6. Comparing intensities of bands in lanes 9 with those in lane 6, bands with decreased and increased intensity are marked by asterisks and close circles at the right of lane 9, respectively. Numbers at the left indicate distance in nucleotide from the BstNI site (Supplementary Figure S2).

