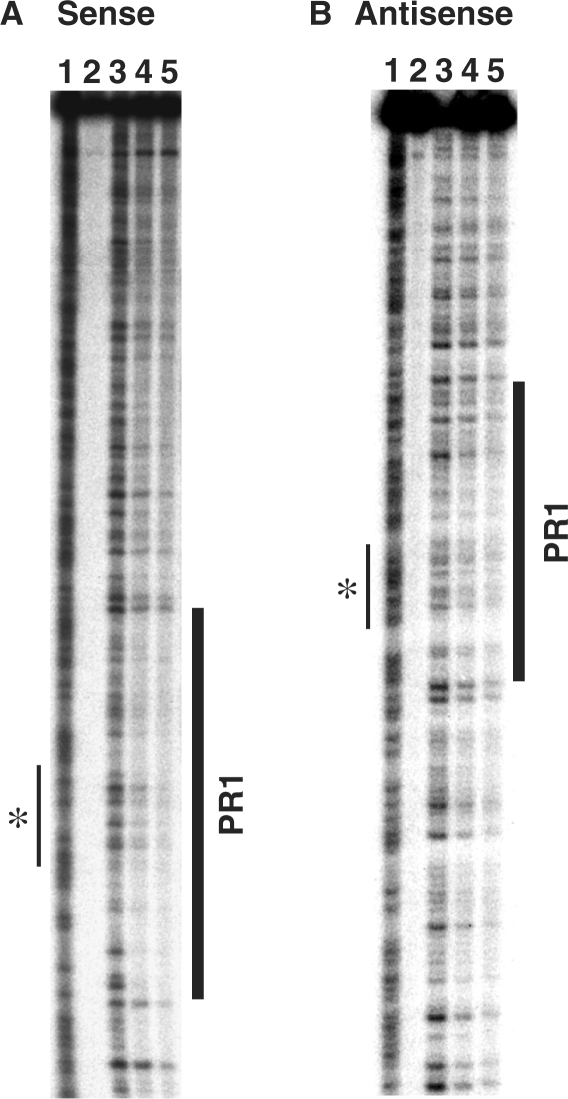
Figure 1.
In vitro DNase I footprinting of the +6.8 kb DHS probe. Experiments using (A) sense and (B) anti-sense strands are shown. Both gel images are labelled as follows: 1, AG ladder; 2, No DNase I; 3, No Caco2 nuclear extract; 4 and 5, 40 μg and 80 μg Caco2 cell nuclear extract, respectively. For both panels, protected region 1 (PR1) is highlighted by a bold vertical line. Narrow vertical line marked with an asterisk shows position of putative CTCF-binding site.

