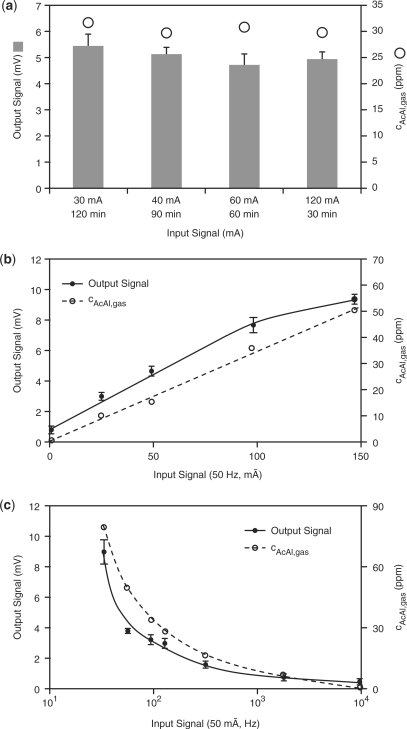
Figure 2.
Electro-genetic circuits. (a) Mammalian cell-based integrator. The CPU was connected to DC of different intensities and for various periods of time; the product of time and current intensity was kept constant (t × I = constant). The resulting acetaldehyde levels and electric output signals were scored after 24 h. (b) Mammalian cell-based AM detector. The CPU was connected to an AC of 50 Hz and different intensities for 1 h and the acetaldehyde levels as well as the electric output current were quantified after 24 h. (c) Mammalian cell-based FM detector. The CPU was connected to an AC of 50 mA and different frequencies for 1 h and the acetaldehyde levels as well as the electric output current were quantified after 48 h.

