
Figure 4. Change of Relative Estimated Variability plotted against change of coordination percent when comparing Cx43−/− and wildtype brains.
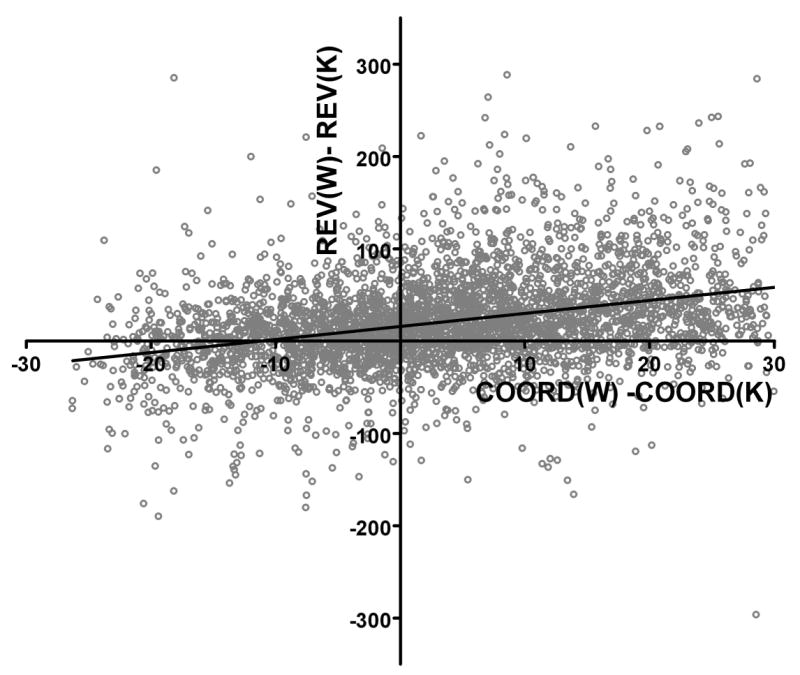
Note the significant proportionality between reduction of (synergistic + antagonistic) expression coordination and reduction of expression variability. The slope of the linear regression curve of significantly (p < 0.0001) non-zero.