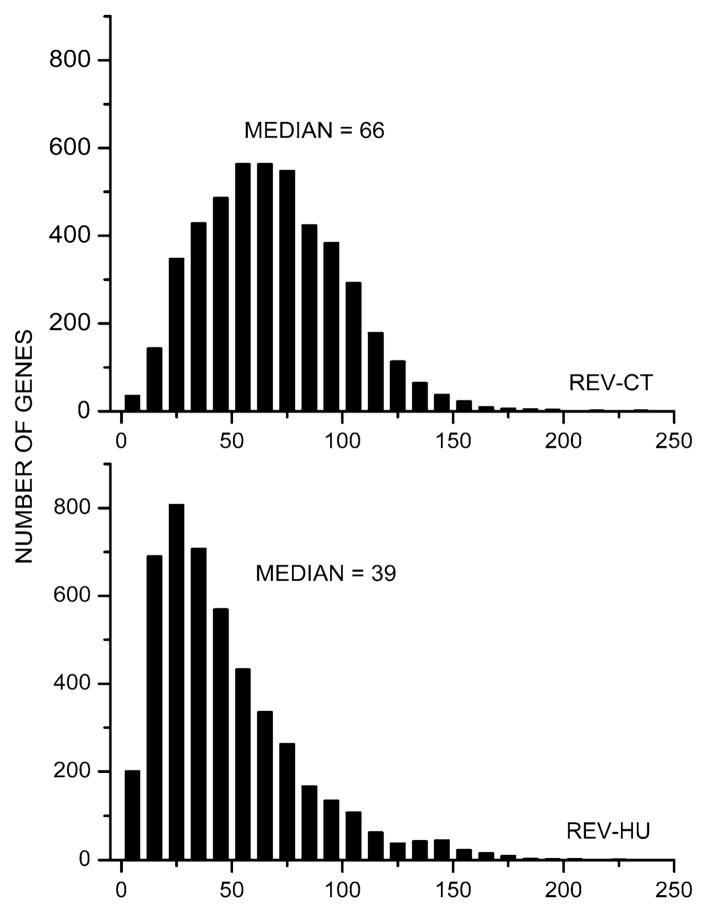
Fig. 2.
Histograms of the relative expression variability in brain of control (CT) and tail- suspended (HU) mice. Note the substantial reduction of the median relative expression variability in HU mice compared to that of CT mice indicating a significant increase of the overall control of transcripts’ abundance

