
Figure 2.
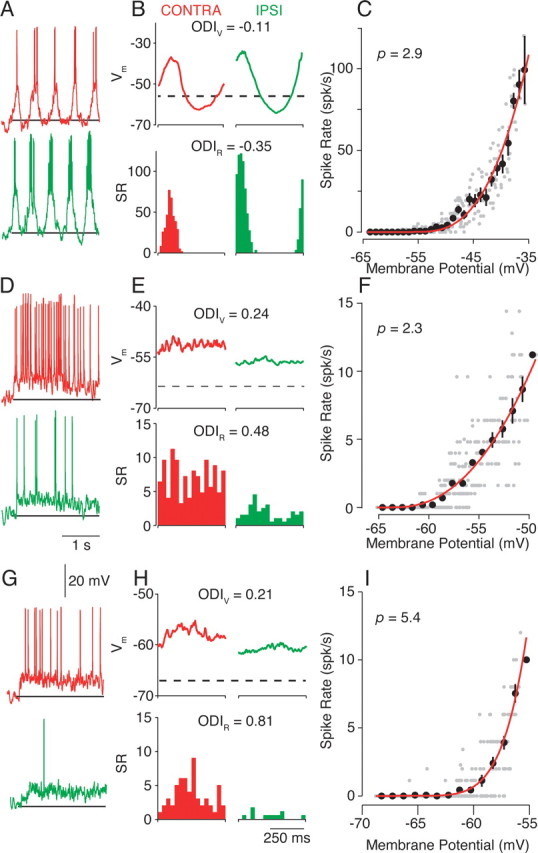
Intracellular measurements of ocular dominance. A, Single-trial responses to high-contrast (64%) drifting gratings in the preferred orientation. Both contralateral (CONTRA; red trace) and ipsilateral (IPSI; green trace) responses are shown. The horizontal line indicates the resting membrane potential and marks the stimulation presentation. B, Cycle-averaged responses for V m (in millivolts; top) and spike rate (SR) [in spikes (spk) per second; bottom]. Resting membrane potential is indicated by the dashed line. C, The V m-to-spike-rate transformation is fit by a power-law function (Eq. 2; red line). Thirty millisecond epochs of mean membrane potential and spike rate are indicated by gray dots. The fit exponent value, p (Eq. 2), is indicated in the top left corner. The average and SE firing rate for membrane potentials in 1 mV bins are indicated by black dots. D–F and G–I follow the conventions of A–C for two additional neurons.