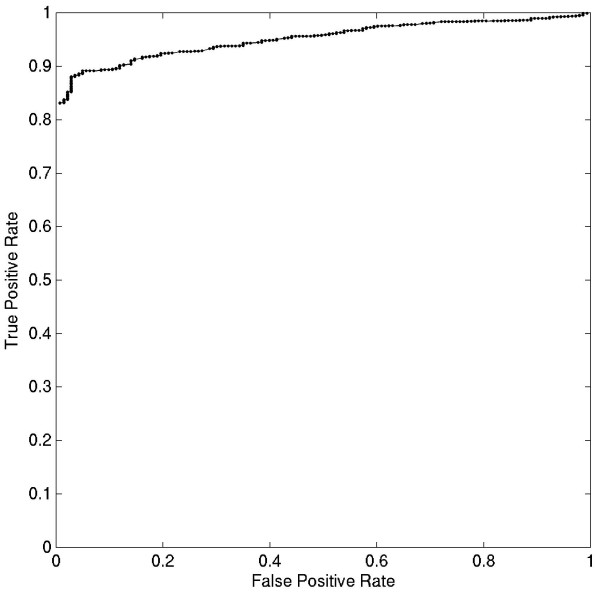
Figure 2.
ROC curve analysis carried out on simulated data. As described in the text, false positive accumulation rate and true positive accumulation rate were calculated by varying the <CDISS> cut-off at regular intervals. The false positive and true positive rates at different <CDISS> cut-offs are plotted.

