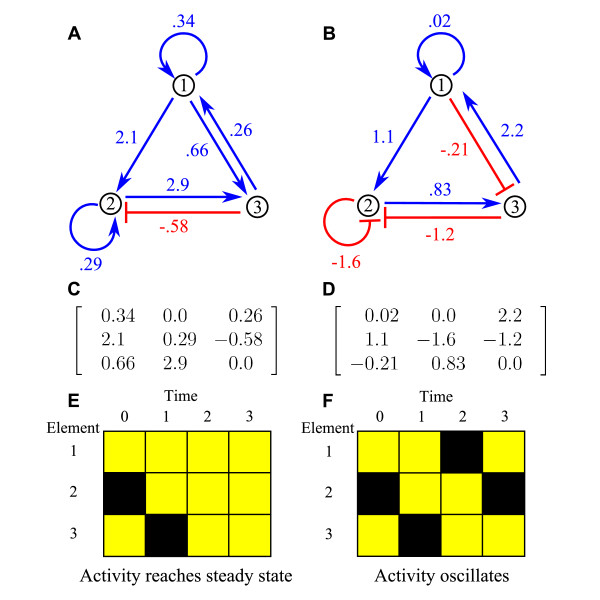
Figure 1.
Example networks and dynamics. A and B: sketches of 3-node networks. Numbered points represent nodes and arrows interactions; blue/red arrows show activating/inhibiting connections. The interaction strength is given next to each arrow. The two networks have the same topology but differ in connection strengths and activating fraction of connections a; B shows a lower a. C and D: matrices W which represent networks A and B, where Wij is the interaction strength from node j to node i. E and F: Network dynamics with initial condition s(t = 0) = (1, -1, 1). Active/inactive nodes are represented by yellow/black squares The activity of network A reaches steady state after 2 iterations (E). The activity of network B undergoes period-3 oscillation (F).

